
Optimizing Urban Bike Sharing with Spatio Temporal Graph Modeling
In this project, I implemented the Spatio Temporal Graph Convolutional Network (STGCN) model, drawing on the architecture and methodologies described in the referenced paper. The STGCN is composed of several spatio-temporal convolutional blocks, each forming a “sandwich” structure with two gated sequential convolution layers and a spatial graph convolution layer in between.
These spatio-temporal convolutional blocks are crucial for fusing features from both spatial and temporal domains, allowing the model to process graph-structured time series effectively. The unique design of these blocks, with a spatial layer bridging two temporal layers, facilitates fast spatial-state propagation through both graph and temporal convolutions. This structure also enables the application of a bottleneck strategy, optimizing the network’s efficiency.
I leveraged these elements of the STGCN model to analyze and predict bike traffic in Jersey City using data from the Citi Bike system. The model’s ability to handle complex spatio-temporal data was instrumental in understanding and forecasting bike usage patterns across different stations and times. This was particularly valuable given the challenges posed by the high nonlinearity and complexity of urban traffic flow, as highlighted in the paper.
Data
Rides data from 01-01-2017 to 10-01-2023 of Jersey City was used for this analysis. The data was cleaned and prepared for the analysis:
- I addressed missing data and outliers. Specifically, I removed 77 records with missing start station IDs and 9,168 with missing end station IDs.
- For distance-based analysis, I calculated the haversine distance between the start and end stations using their latitude and longitude coordinates.
- Outliers, identified as rides that were three standard deviations from the mean distance of all rides, were dropped—amounting to 787 rides.
- Additionally, I removed 97 rows where the ride durations were negative, ensuring data consistency and reliability for further analysis.
Network Visualization
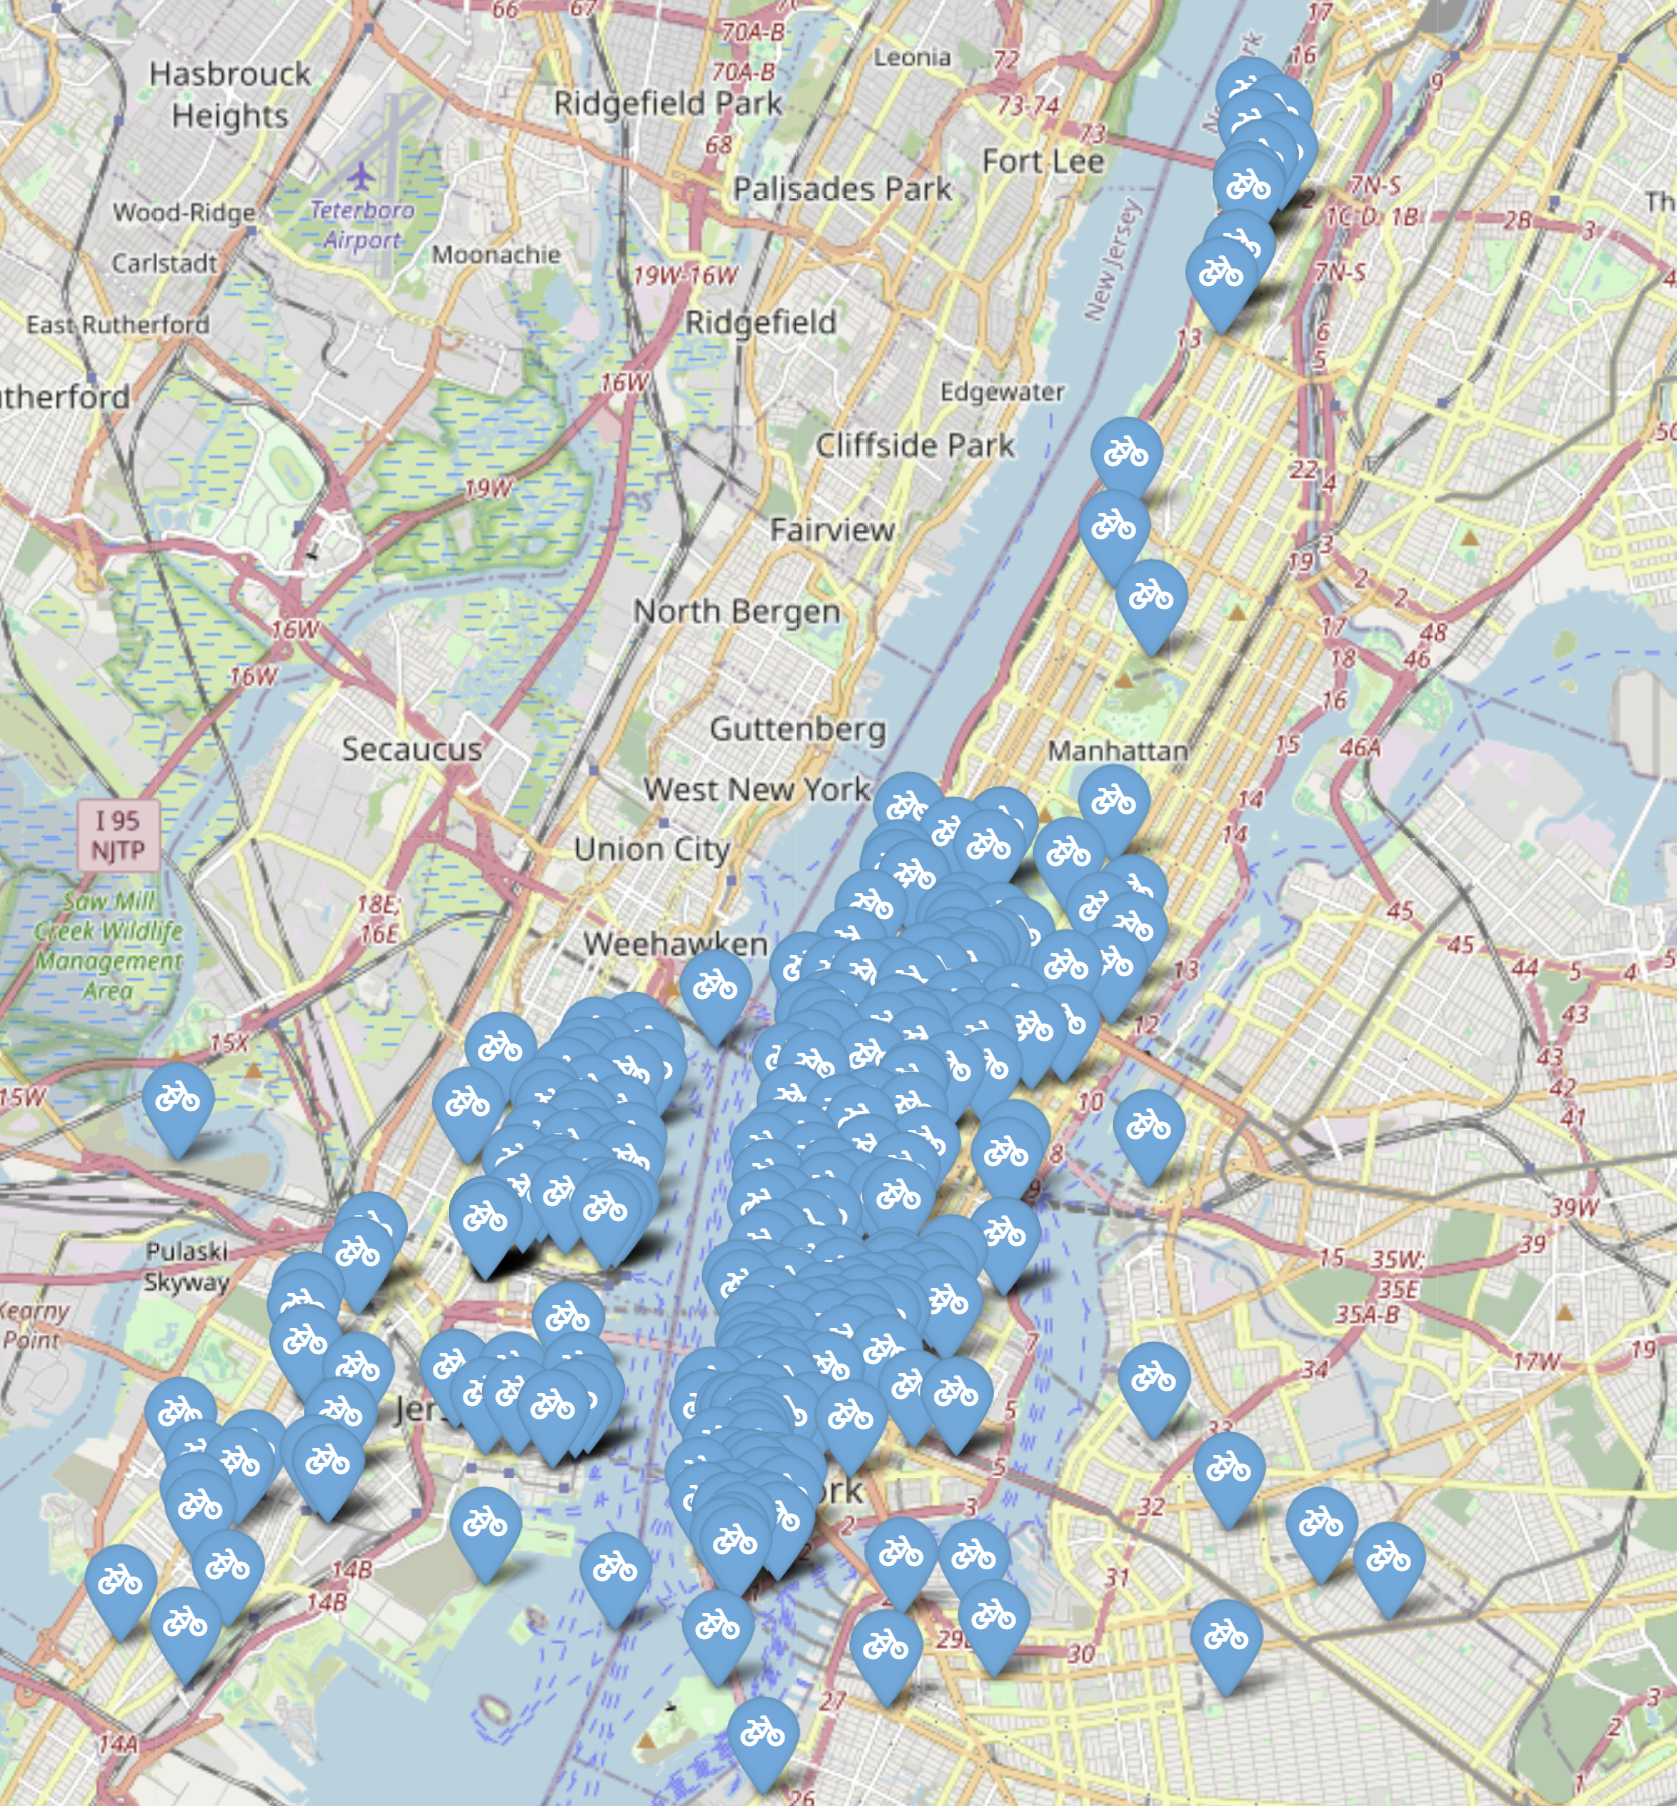
Performed centrality analysis to identify the key stations in the network. Harborside emerged as the most central node by degree, closeness, and betweenness centrality, indicating it’s a crucial hub with many connections, allowing efficient travel across the network, and it bridges various indirect paths, facilitating connectivity within the system.
Some insights from Exploratory Data Analysis
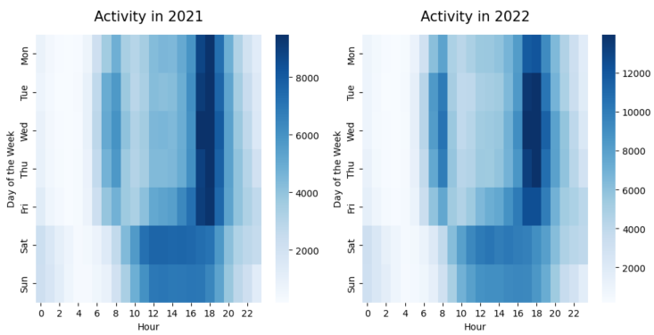
During weekdays, bike ride activity peaks before and after typical office hours, while on weekends, there is a noticeable increase in rides around midday, particularly between 12 PM and 4 PM. This suggests a clear distinction in usage behavior between weekdays and weekends.
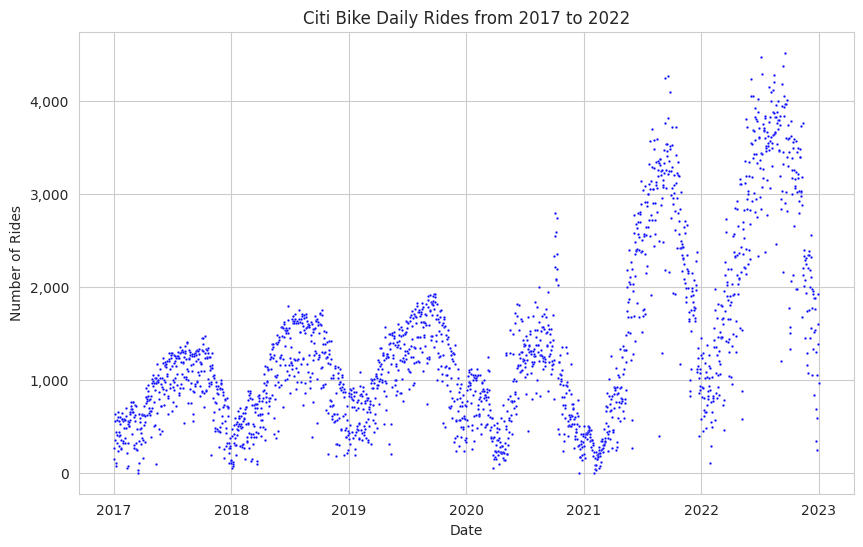
We can see a year-over-year growth trend in bike-sharing usage, with a notable increase in demand in the post-COVID-19 years, suggesting a burgeoning industry. Additionally, there’s a clear cyclical pattern of demand, with seasonality evident in the data showing peaks during summer and dips in winter.
Baseline Model
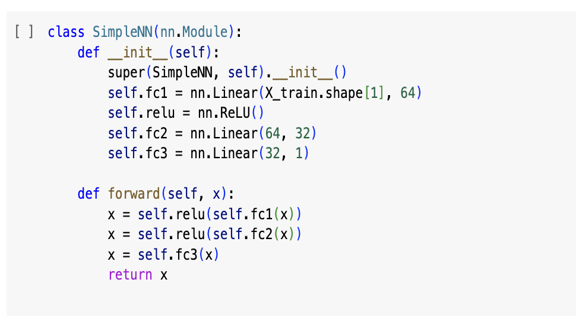
Implemetation of a simple feed-forward neural network:
- This model comprises two hidden layers and utilizes ReLU activation to introduce non-linearity.
- The final output is produced through a linear layer, making the model suitable for predicting continuous variables, such as the number of bike rides.
- Training the network with hyperparameters set to a batch size of 32 and using the Adam optimizer over 10 epochs to minimize the loss function effectively.
- The RMSE for incoming rides was 2.27 and for outgoing rides at 2.25, while the MAE was 1.46 for incoming and 1.50 for outgoing rides.
STGCN Model
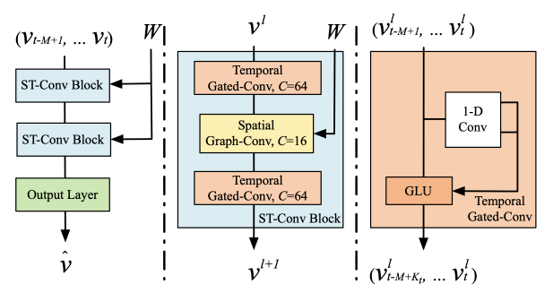
- In this model’s implemented architecture, I have used only one spatio-temporal convolution (ST-Conv) block because using 2 led to overfitting during training. Subsequently there is an output layer with a final temporal convolution and a fully-connected layer.
- The ST-Conv block consists of a spatial graph convolution between two temporal convolution layers. Temporal convolution layers work like time series prediction models, which applies a function to each of the values in the window of these time steps.
- The output of this function is passed to a Gated Linear Unit (GLU), which selects features that are relevant for subsequent predictions.
Using our Citi Bike model as context, traffic information of these bikes at one station will influence the traffic information at nearby stations.
- Features
- Number of unique stations: 498
- Number of net rides for every 30 minute interval
- Number of 30 minute intervals interval for 2023 data = 13104
- V: Node features - Net rides for each node in the graph at each point in time
- W: Distance for the edges between each pair of nodes(stations)
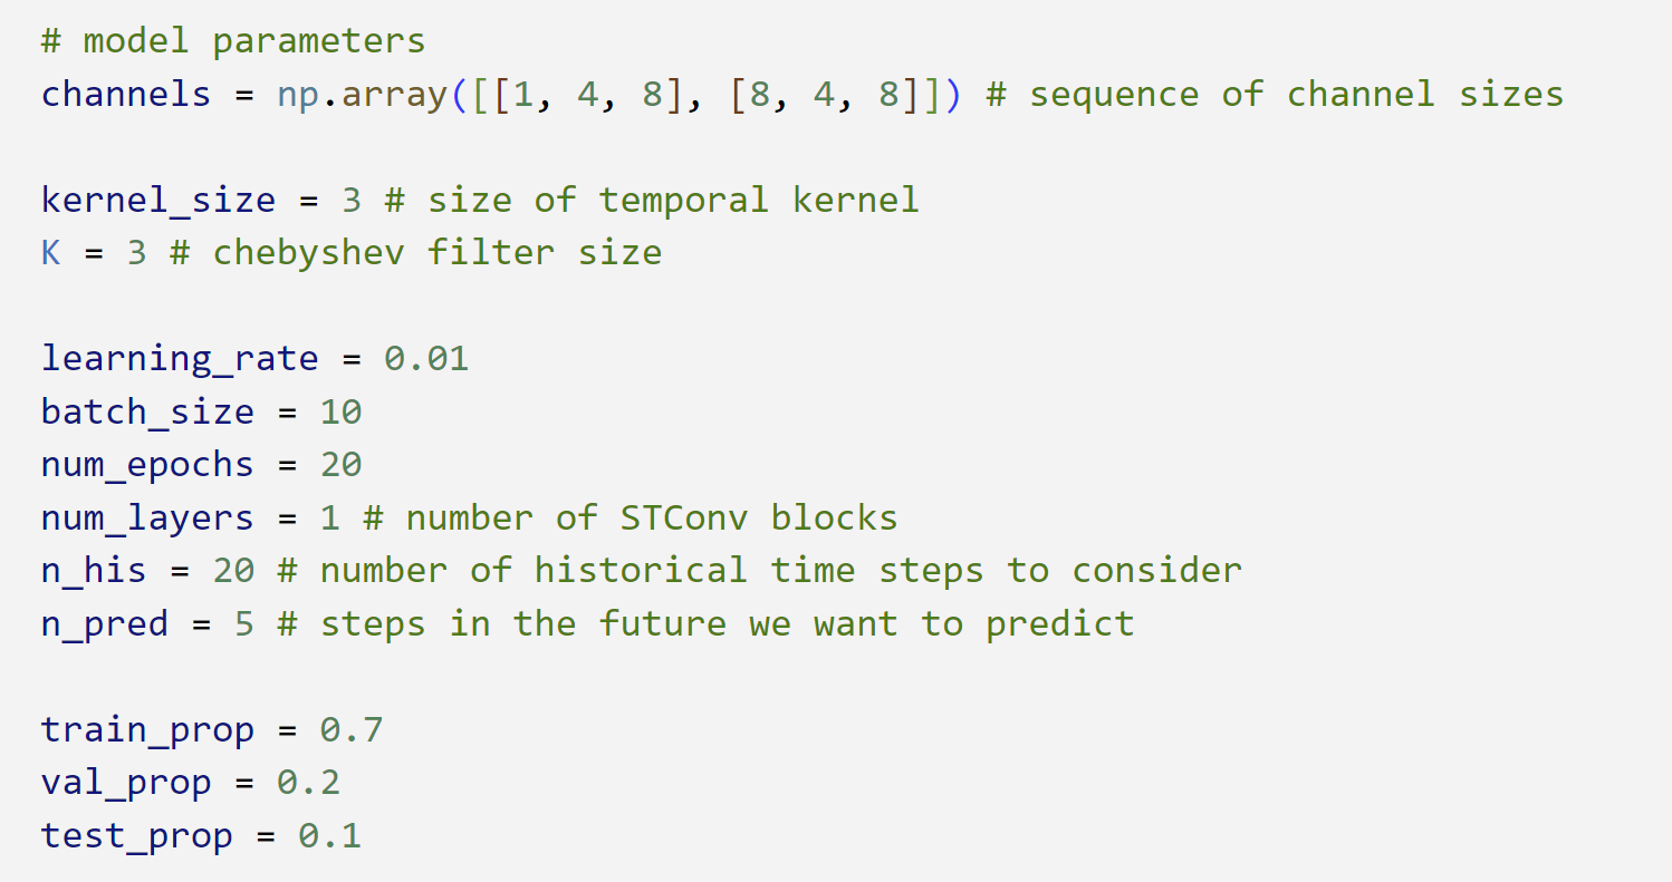
Model Parameters
- Model Testing
Upon testing the STGCN model, the evaluation metrics indicated strong predictive performance with a mean absolute error (MAE) of 0.20 rides and a root mean square error (RMSE) of 0.77 rides.
Conclusions
- On analyzing the station ride data we find that there is maximum activity in stations such as Grove St PATH station, Hamilton Park and Newport PATH.
- Ride data across Jersey City shows sparsity, indicating most rides occur on a limited number of paths, primarily fueled by a few stations.
- Stations with high demand like Grove St Path and Hamilton Park show significant imbalances in net rides.
The complete code and analysis is here.