
Amazon Product Co-Purchasing Network Analysis
How Can We Accurately Recommend Products on Amazon Using Network Analysis?
In this project, I developed a network analysis system to analyze and recommend Amazon products. This involved applying network analysis, particularly centrality metrics, and regression models to predict product sales ranks. Ego graph-based methods were also used for product recommendations based on user behavior.
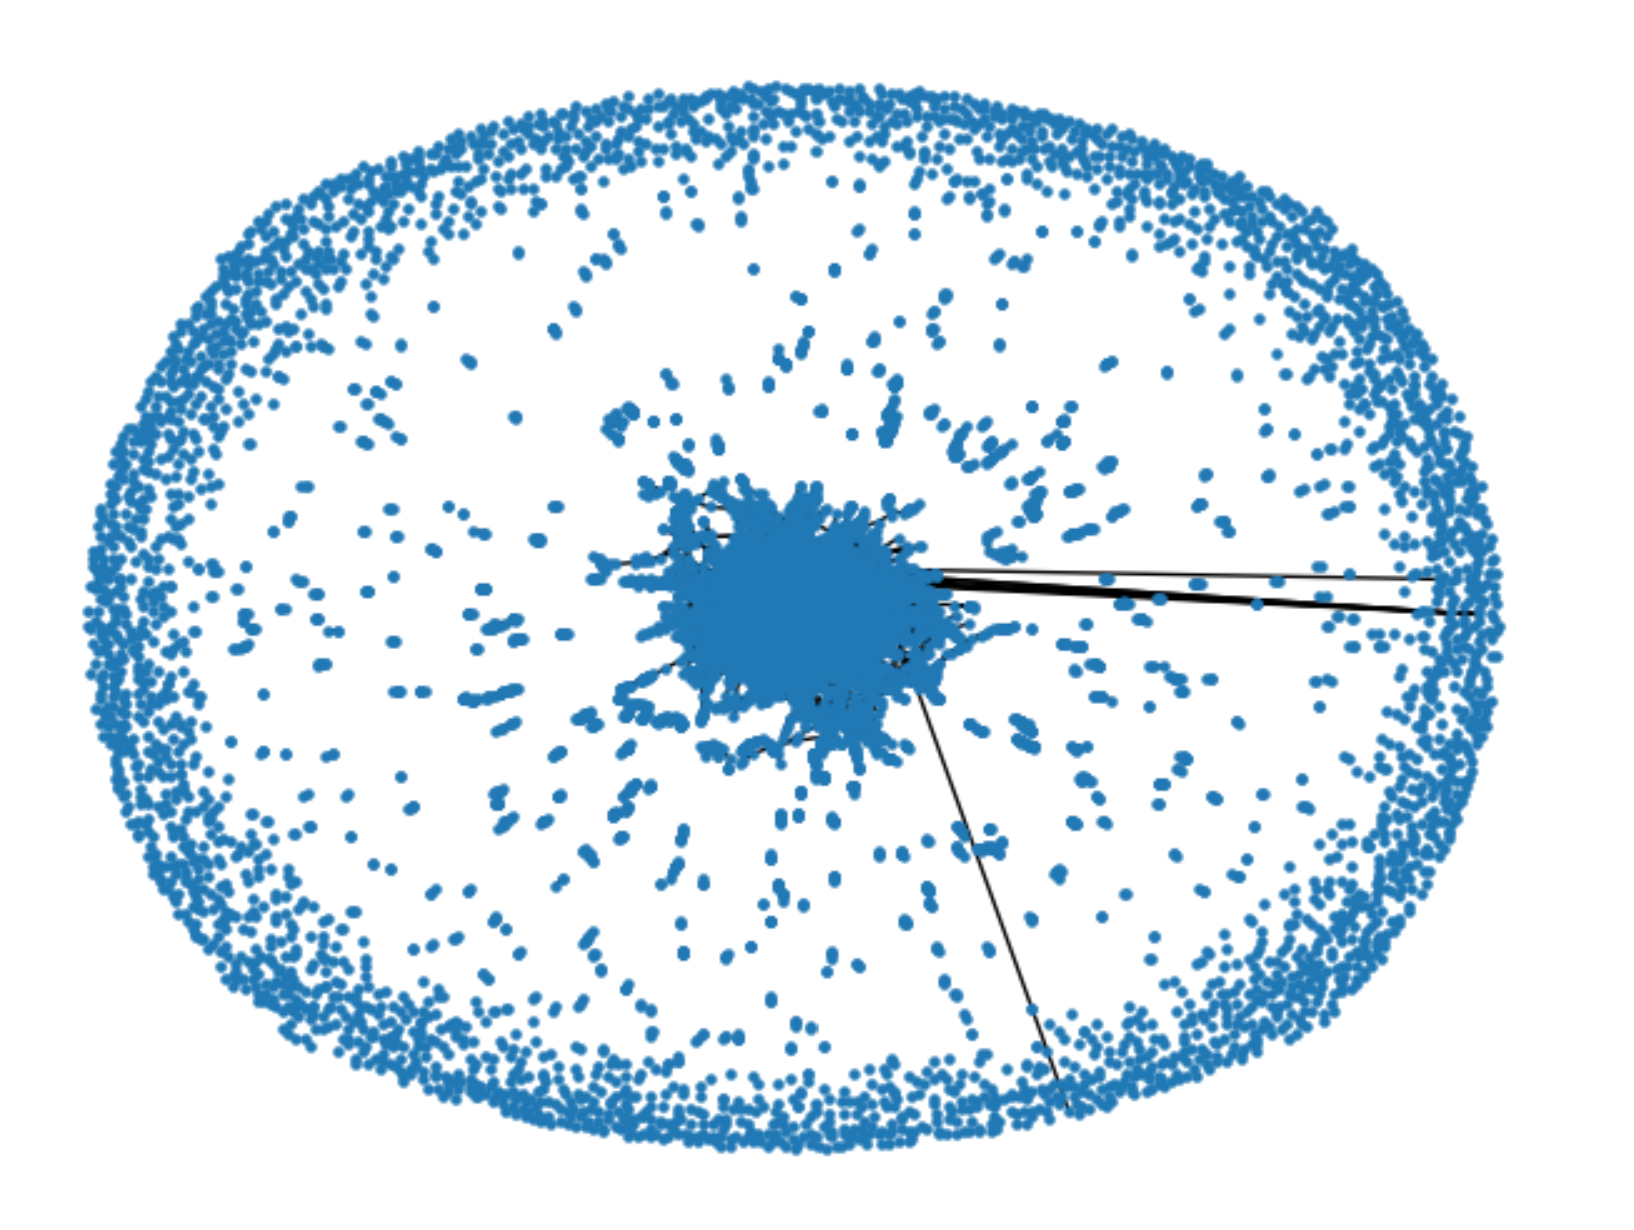
The focus was on overcoming the challenges of visualizing large graphs by using algorithms to identify communities and clusters. This study delved into the intricacies of product recommendation systems, highlighting the limitations of traditional Machine Learning methods in graph-based environments where standard distributions may not adequately represent the dataset.
Data Description
The dataset includes 548,552 different product reviews and product metadata (Books, music CDs, DVDs and VHS video tapes).
For each product the following information is available:
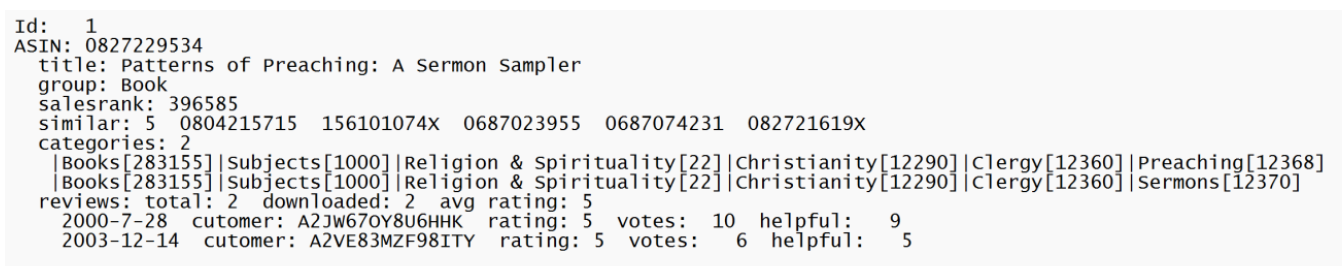
• Id: Product id (number 0, …, 548551) • ASIN: Amazon Standard Identification Number
• title: Name/title of the product
• group: Product group (Book, DVD, Video or Music)
• salesrank: Amazon Salesrank
• similar: ASINs of co-purchased products (people who buy X also buy Y)
• categories: Location in product category hierarchy to which the product belongs (separated by |, category id in [])
• reviews: Product review information: time, user id, rating, total number of votes on the review, total number of helpfulness votes (how many people found the review to be helpful)
Key Components of this Project
Amazon Co-Purchase Network Analysis
- Data Preprocessing: Amazon product data was structured into a dictionary, extracting key attributes such as product ID, title, category, sales rank, and reviews.
- Attribute Extraction: Isolated key data such as ID, ASIN, Title, Group, Salesrank, Similar products, Categories, and Reviews from the text.
- Text Cleaning: Removed stopwords and cleaned text in the Categories section.
- Segmentation and Merging: Divided the data by product Group (DVD, Music, Video, Audio), then combined and verified the counts.
- Similarity Analysis: Stripped and compared category words between products to calculate similarity.
- Data Organization: Organized all processed data and metrics into a structured dictionary format.
- Network Analysis and Regression Modeling: Created a network of products based on similarities, using the Jaccard index for edge weights. Degree centrality and clustering coefficient metrics were analyzed, informing the regression model used to predict product sales ranks.
The regression model, designed to predict Sales Rank where a lower rank indicates higher sales, anticipates negative coefficients, as an increase in feature values should correspond to a lower rank. To enhance the model’s performance, regularization techniques like Lasso and Ridge Regression were utilized for feature selection and modification.
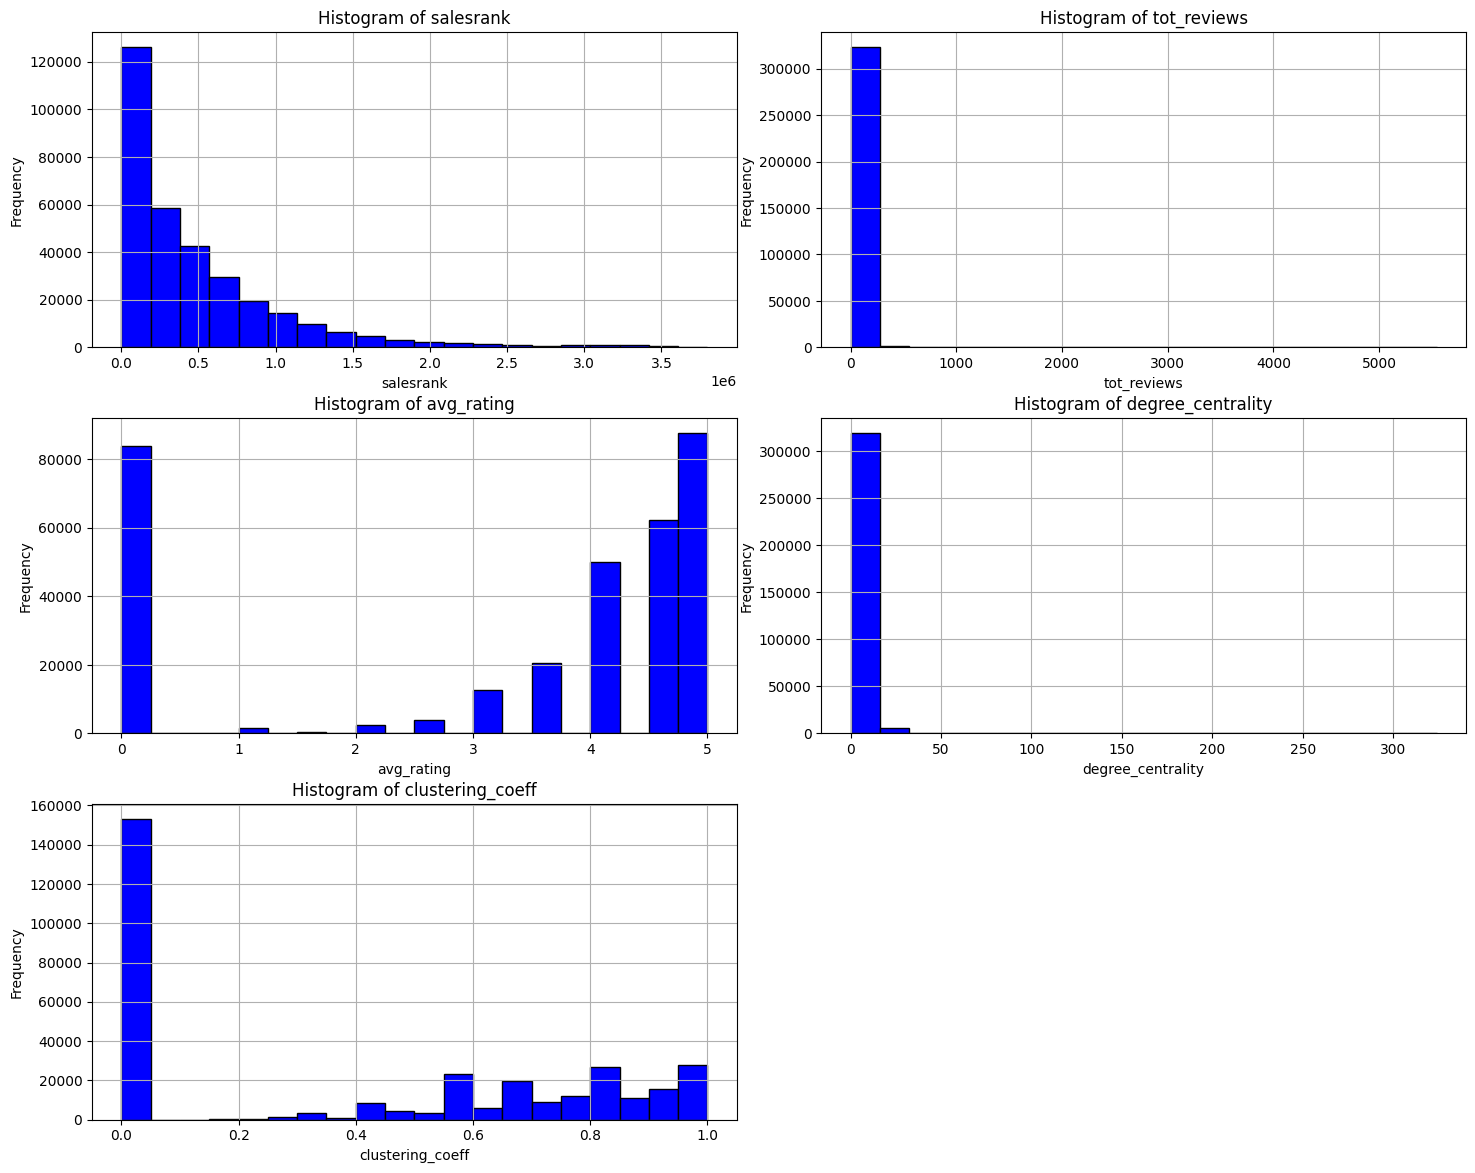
From the above visualizations, we can observe that:
• There are few products with average rating as 0. In the regression model, products with an average rating of 0 were excluded under the assumption that these represented instances of missing ratings and were therefore considered outliers.
• A few nodes with degree centrality above 0 are key, as they could be influential or catalyst products in the network, likely due to their role as essential accessories or components for other products.
• Many products in the Amazon co-purchase dataset have a clustering coefficient over 0.2, about one-sixth based on the area under the curve. This data can inform a priority queue for promoting and advertising products, aiding in enhancing engagement through inorganic growth strategies.- Community Detection Limitations: While community detection was considered for improving model accuracy, computational limitations hindered the implementation of algorithms like the Girvan Newman Algorithm. The extensive time complexity of these algorithms, relative to the size of the network, made their application impractical for this dataset.
- Data Preprocessing: Amazon product data was structured into a dictionary, extracting key attributes such as product ID, title, category, sales rank, and reviews.
Analysis of Network Centrality Metrics
Centrality Metrics Analysis in DVD Subgroup: The project focuses on analyzing the centrality metrics of the DVD subgroup (19,828 products) within Amazon’s co-purchasing network, due to the full network’s large size (548,552 products). Key metrics include Degree, Betweenness, Closeness, and Eigenvector Centrality, aiming to identify influential DVDs based on their network position and connections.
Identifying Influential Products: The analysis used these metrics to pinpoint the most popular DVDs (Degree Centrality), products frequently bought with others (Betweenness Centrality), and the most co-purchased items (Closeness Centrality). DVDs were also categorized by genres to further refine the analysis.
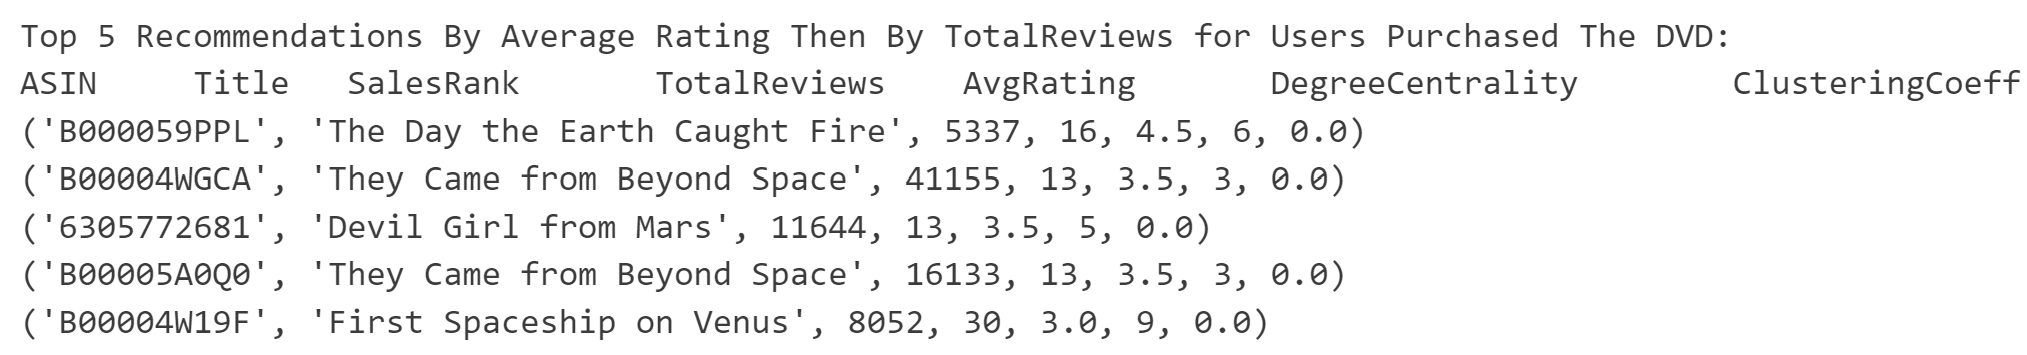
Filtering Similar Products: For each purchased product, an ego graph is created, and products similar to the purchased item are filtered using a similarity threshold. This process narrows down the product selection to a more relevant and focused group, based on their interconnectedness in the purchasing network.
Ranking and Displaying Recommendations: The filtered similar products are ranked according to their average rating and total reviews. The top 5 products from this ranking are then selected, and their details like title, sales rank, and ratings are displayed to the customer as the most relevant recommendations.
The complete code is available here.