
Enhancing Supply Chain Risk Management: A Hybrid DEMATEL-ANP Methodology
This project focuses on managing risks in the Indian electronics supply chain (ESC). It highlights the essential role of supply chain management in the modern business landscape, especially given the risks posed by factors like globalization, market competition, and supplier performance. By studying significant risk drivers and their interrelationships in the ESC, the project utilized a hybrid Multi-Criteria Decision Making (MCDM) technique - DANP (DEMATEL and ANP), to quantify the overall inbound supply risk score (ISRS). This approach enabled a realistic assessment of risk factors, guiding in effective risk mitigation strategies.
Methodology
- Supply Chain Risk Management (SCRM) is treated as a multi-criteria decision-making (MCDM) problem, involving multiple risk factors and indicators.
- MCDM is preferred for its simplicity, requirement of fewer samples, and efficiency in capturing quantitative measurements of dynamic risks and risk indicators to achieve the total risk score.
Multi-Criteria Decision Making (MCDM)
- MCDM involves selecting alternatives based on multiple conflicting qualitative and quantitative criteria.
- MCDM serves as an interface between decision-makers and analysts, especially when conflicting criteria are involved. The final decision must be acceptable to all stakeholders.
- In this study, DEMATEL and ANP are integrated into a method known as DANP to calculate the overall inbound supply risk score (ISRS) for the Indian electronic supply chain.
A systematic literature review was conducted to identify inbound supply risk factors specific to the electronics industry. This review highlighted the high uncertainty in supply and demand, a variety of products, changing customer preferences, and quality issues leading to significant risks in the supply chain.
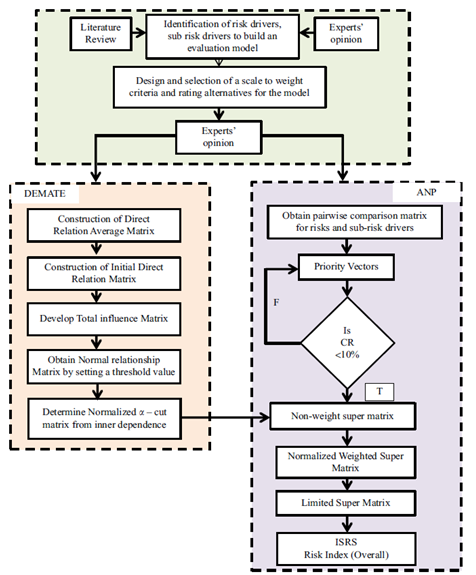
DEMATEL (Decision-making Trial and Evaluation Laboratory)
DEMATEL is used for identifying cause-effect relationships in complex systems, evaluating interdependent relationships among factors.
- It involves creating a Network Relationship Map (NRM) to analyze interdependencies, unlike other methods like AHP, ANP, and TOPSIS where factors are considered independent.
- Direct Relation Matrix (DRM) DRM is used to show the degree of influence of risk indicators on their respective risk factors, rated on a standard scale from 0 (no influence) to 4 (extreme influence).
- Decision-Makers’ Role Twelve decision-makers evaluated and scored the interrelationships between risk indicators and risk factors, forming six direct relation matrices from the average of all ratings.
ANP (Analytical Network Process)
ANP is an extension of the Analytical Hierarchy Process (AHP), addresses the limitations of AHP by handling feedback and interdependence between alternatives and criteria.
- ANP structures decision problems into networks (as opposed to hierarchies in AHP), considering dependence among different clusters and within clusters.
- ANP estimates the importance level or priority value of various decision indicators, integrating DEMATEL and ANP for calculating the inbound-supply risk score.
Case Study
- The Indian Electronics Industry, categorized as developing, has a significant market size of US$76.92 billion and is expected to grow considerably.
- About 60% of electronic components in this industry are imported, making India highly susceptible to inbound supply risks.
- The industry faces issues like limited supply base, skewed taxation policies, and poor infrastructure, leading to delays and increased dependency on imports.
- The underdeveloped nature of India’s Electronic Supply Chain compared to developed countries highlights the necessity of effective Supply Chain Risk Management (SCRM) practices.
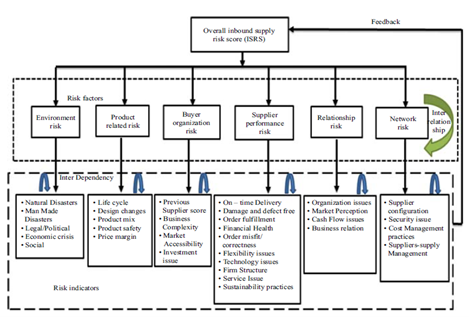
ISRS Framework
- The study utilized convenience sampling for analysis, involving 12 experts with substantial experience in supply chain practices, to ensure realistic results and validate the proposed ISRS framework for the Electronics Supply Chain in India.
- ANP was utilized to construct the initial influence matrix for DEMATEL, which then aided in obtaining an overall risk score via ANP.
- Experts used Saaty’s nine-point scale for weighing risk factors, where ‘1’ indicates equal importance, and ‘9’ signifies extreme importance.
- Decision-makers’ choices were aggregated into a PCM using the linear average method, indicating the mutual significance of risk factors in relation to the overall Inbound Supply Risk Score (ISRS).
- Direct Relation Matrix (DRM) was eveloped to denote the degree of direct influence between risks, using a scale from 0 (no influence) to 4 (extreme influence).
- Six DRMs and six PCMs were used as inputs for the model, with the results discussed in detail in the following section.
STAGE 1: ANP Calculation
ANP was calculated without considering the interdependence between risk drivers.
Importance of Risk Factors
- Pairwise Comparison Matrix (PCM): Used to compare risk factors based on expert opinions to calculate their priority values in relation to the overall ESC risk index.
- Priority Value Calculation: Involved summing each column in the PCM, normalizing the matrix, and then calculating the average of each row to obtain priority values.
- Key Findings: Supplier performance risk was identified as the most critical risk factor, followed by product risk and environmental risk.
Importance of Risk Indicators
For each of the six risk factors, priority values (PV) of their respective risk indicators was calculated.
- Risk Factor 1: Environment
- Economic risk, followed by legal/political risk and social risk, were identified as the most impactful on the environment risk driver.
- Risk Factor 2: Product
- Price margin, product safety risk, and life cycle risk were identified as the most significant.
- Risk Factor 3: Buyer Organization
- Investment risk and market accessibility risk were identified as the most significant.
- Risk Factor 4: Supplier Performance
- Damage and defect-free components, and order misfit were identified as the most critical risk indicators.
- Risk Factor 5: Relationship
- Cash flow issue risk was identified as having the highest impact on buyer-supplier relationships.
- Risk Factor 6: Network
- Suppliers’ supply management and supplier configuration were identified as the most crucial risk indicators.
In each case, the process involved the calculation of a pairwise comparison matrix, its normalization, and then determining the priority values for risk indicators. 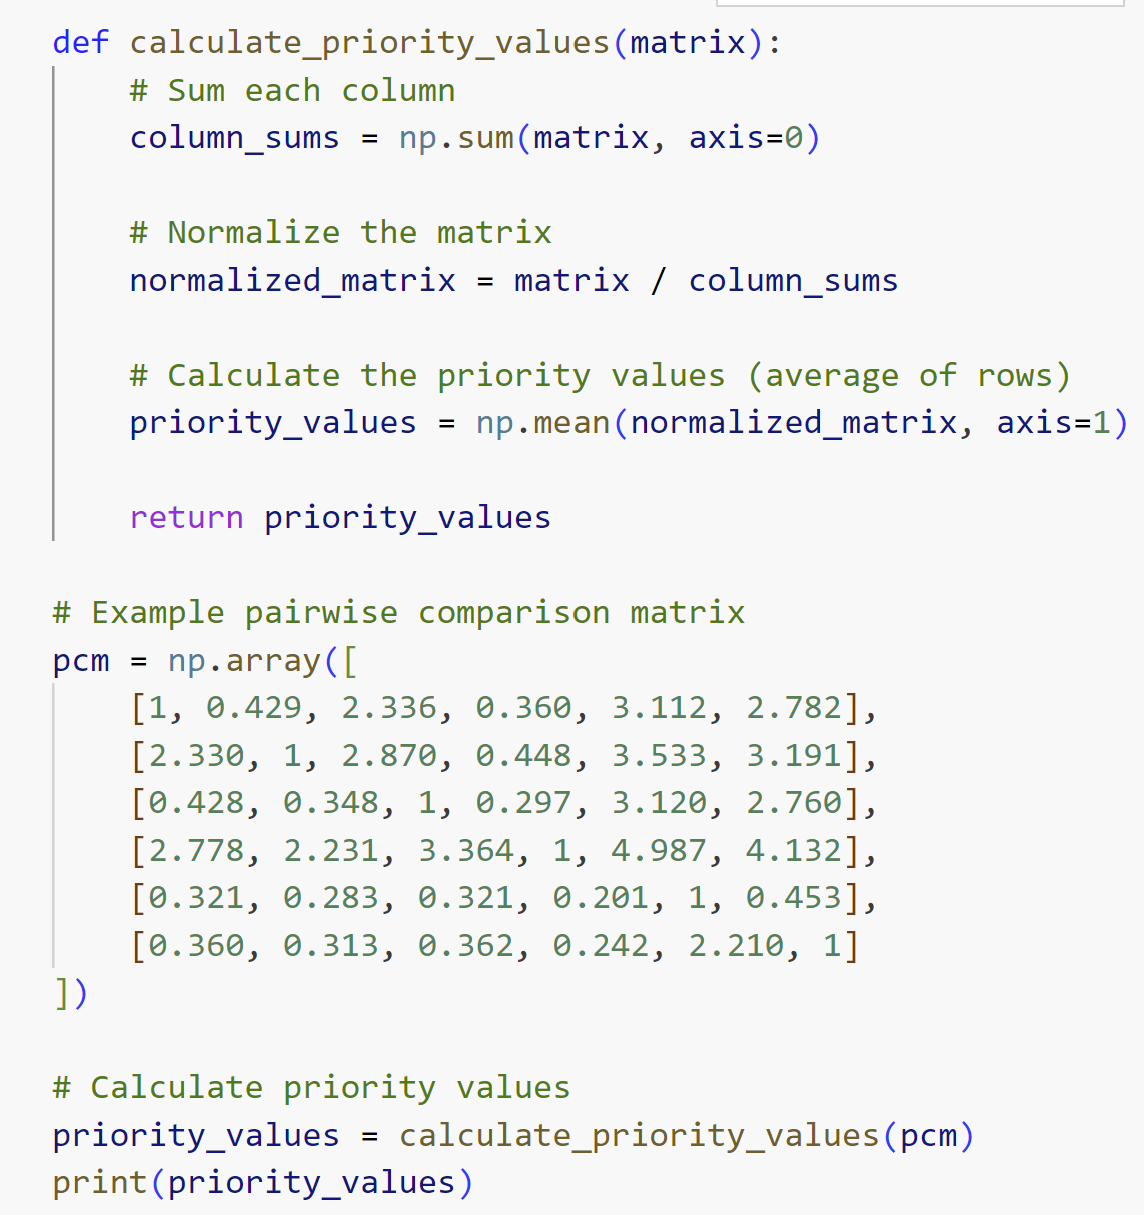
STAGE 2: DEMATEL Calculation
- Generation of Direct Relation Matrix (DRM): This matrix illustrates the influence of one risk factor over another. The average DRM for risk factors and risk indicators is calculated based on the influence scores given by each expert.
- Normalizing the DRM: The average DRM (A) is normalized by dividing all its elements by a specific value (16.451 in this case) to balance the scale of influence.
- Total Influence Matrix Calculation: The total influence matrix (T) is derived using the formula T = X(I-X)^(-1), where X represents the normalized DRM and I is the identity matrix.
- α-Cut Total Influence Matrix: From the total influence matrix, an α-cut matrix is obtained with a cut-off value (0.260 in this case). This matrix helps in identifying significant influences.
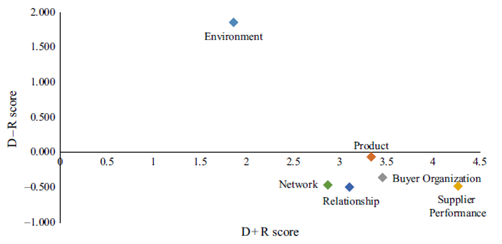
- Network Relation Map (NRM) Generation: Using the α-cut total influence matrix, the NRM is created, visually representing the level of influence of one risk factor on another. In the NRM, arrows indicate the direction and strength of influence.
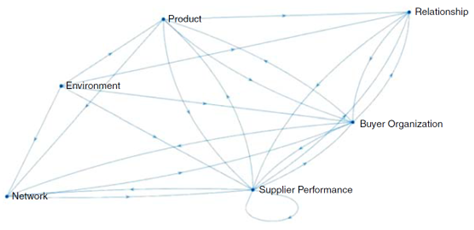
- Cause and Effect Analysis: The nature of each criterion (cause or effect) is determined by measuring D + R and D - R scores. Higher (D + R) scores for certain risk factors (like supplier performance, product, and buyer organization) indicate their high interrelation with other criteria. A positive (D-R) score of a specific risk factor (like environment) suggests it is a primary cause.
- Casual Representation of Risk Factors: The analysis is further visualized through a causal representation diagram, highlighting the cause-effect relationships among the risk factors.
 This process provides a comprehensive understanding of the interrelationships among various risk factors and risk indicators, which is crucial for effective supply chain risk management.
STAGE 3: Integrated DEMATEL-ANP
- DANP Framework Application: The Overall Inbound Supply Risk Score (ISRS) is determined using the DANP framework, which integrates the mutual interrelationships of risk drivers and their global priority values.
- Limiting the Weighted Supermatrix:
- Supermatrix Creation: Generated through pairwise comparisons of risk drivers and α-cut total influence matrices from DEMATEL.
- Normalization: The supermatrix is normalized.
- Limit Matrix Calculation: Achieved by raising the normalized matrix to the 32nd power.
- Priority Values: Global and local priority values of risk drivers are obtained from the limit matrix.
- Rank Comparison: Ranks from the stage-1 ANP pairwise comparison matrix are compared with the global and local weights ranking, highlighting the criticality of supplier performance and product risk factors.
- Overall Inbound Supply Risk Score (ISRS): The ISRS for the Indian electronic supply chain is determined from the first row of the limiting supermatrix, amounting to 0.3572 or 35.72 percent.
STAGE 4: Validation of the Model
- The hybrid Multi-Criteria Decision Making (MCDM) framework, which integrates the DEMATEL and ANP (DANP) methods, is validated by comparing the priority values of risk drivers and sub-risk drivers obtained from the Analytic Hierarchy Process (AHP).
- The validation process reveals notable variations in the ranks of risk indicators when comparing results from AHP with those from DANP. This highlights the importance of considering interrelationships among risk factors.
- For instance, the risk indicator ‘design changes’ ranks 17th in AHP but improves to 5th in the DANP framework. This change is attributed to the consideration of interrelated risk indicators such as damage and defect-free components, technological risk, and flexibility risk, which are critical in real-world scenarios.
- The DANP framework provides a more accurate representation of risk indicators by considering the complexities and interdependencies underlying them. This results in a more comprehensive risk assessment model.
Reference: An integrated framework for the assessment of inbound supply risk and prioritization of the risk drivers: A real-life case on electronics supply chain R KT, SP Sarmah, PK Tarei - Benchmarking: an international journal, 2020