
Enhancing Automotive Assembly Efficiency: A Six Sigma DMAIC Case Study
This project is based on the journal, “Using Six Sigma Methodology to Improve the Assembly Process in an Automotive Company.” It focuses on applying the Six Sigma DMAIC (Define, Measure, Analyze, Improve, Control) methodology for continuous quality improvement, specifically in a sub-assembly process known as “Upper wire horn assembly” within an automotive company.
Six Sigma, aims at reducing defects and improving quality to nearly insignificant levels. It involves statistical measures to ensure processes produce defect-free outputs.
The objective of this study is to address non-conformities in the semi-finished product of the “Upper wire horn assembly” by identifying root causes and developing solutions.
Phase 1: DEFINE
- Process Overview: The assembly line for the “Upper wire horn assembly” involved operations like cutting and stripping cables, crimping terminals, and riveting.
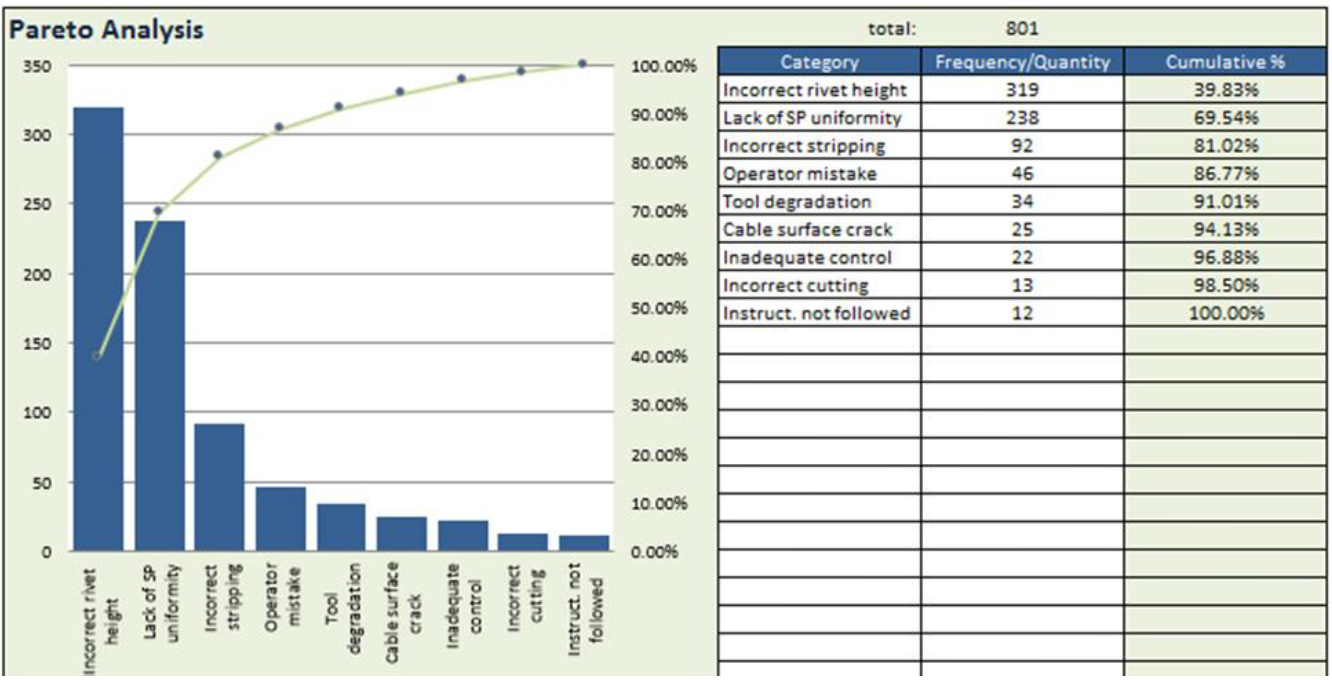
- Pareto Analysis: Applied to 10,000 semi-finished products to identify major defect categories. Identified incorrect rivet height as the main defect (319 out of 801 cases).
Phase 2: MEASURE
- Focal Point: Riveting process, a manual operation, identified as the primary source of defects.
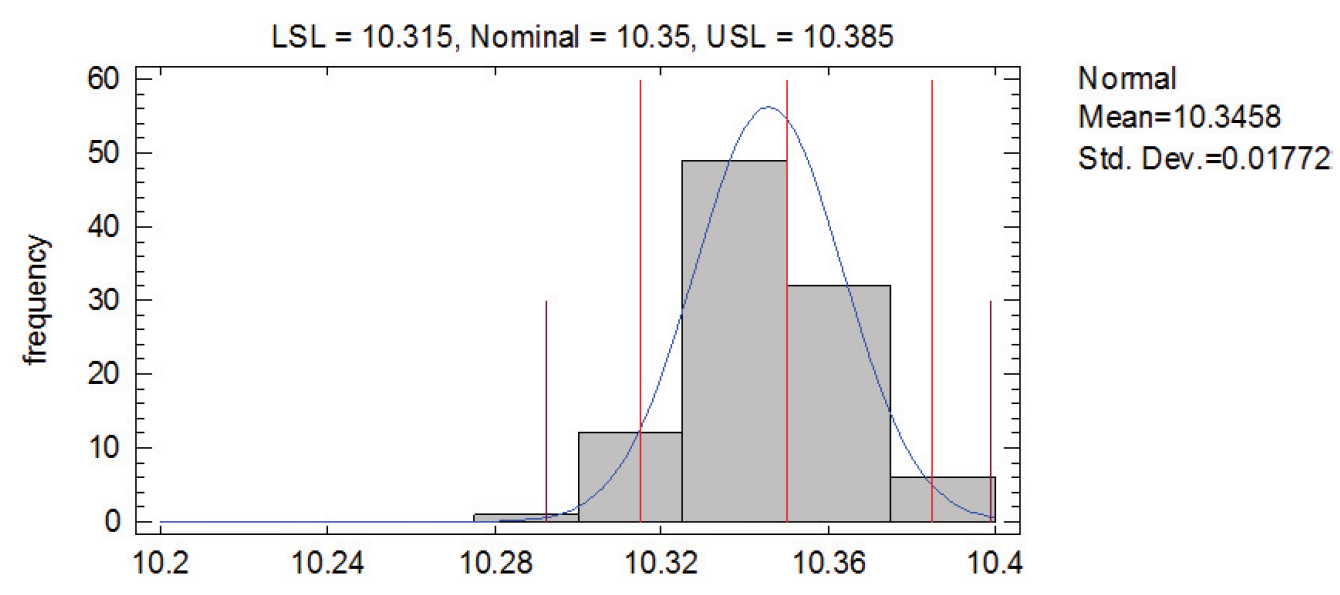
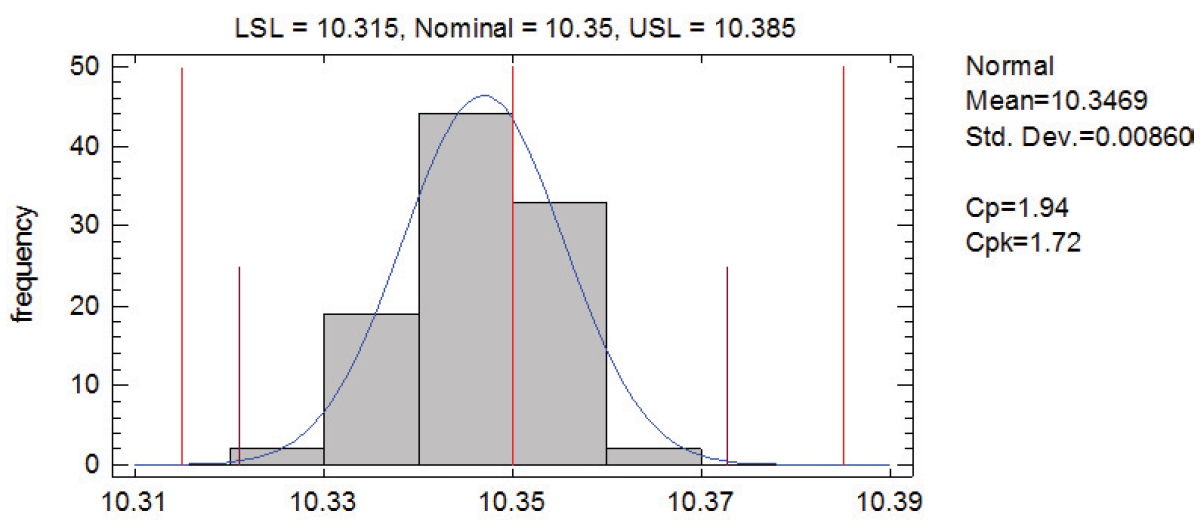
- Quality Metrics: Rivet height (standard: 10.3 ± 0.035 mm) was the critical quality parameter.
- Data Collection and Analysis: Data on rivet height was collected from 20 subgroups, each consisting of 5 semi-finished assemblies. A chi-square test confirmed that the data followed a normal distribution (p > 0.05), indicating process consistency.
- Process Capability Analysis:
- The study assessed whether the process was capable of producing within the set specifications.
- Capability indices Cp and Cpk were calculated. The Cp value was found to be 0.68, indicating that the process was not capable as per the defined specifications.
- The Cpk value was determined to be 0.96, highlighting the need for process centering.
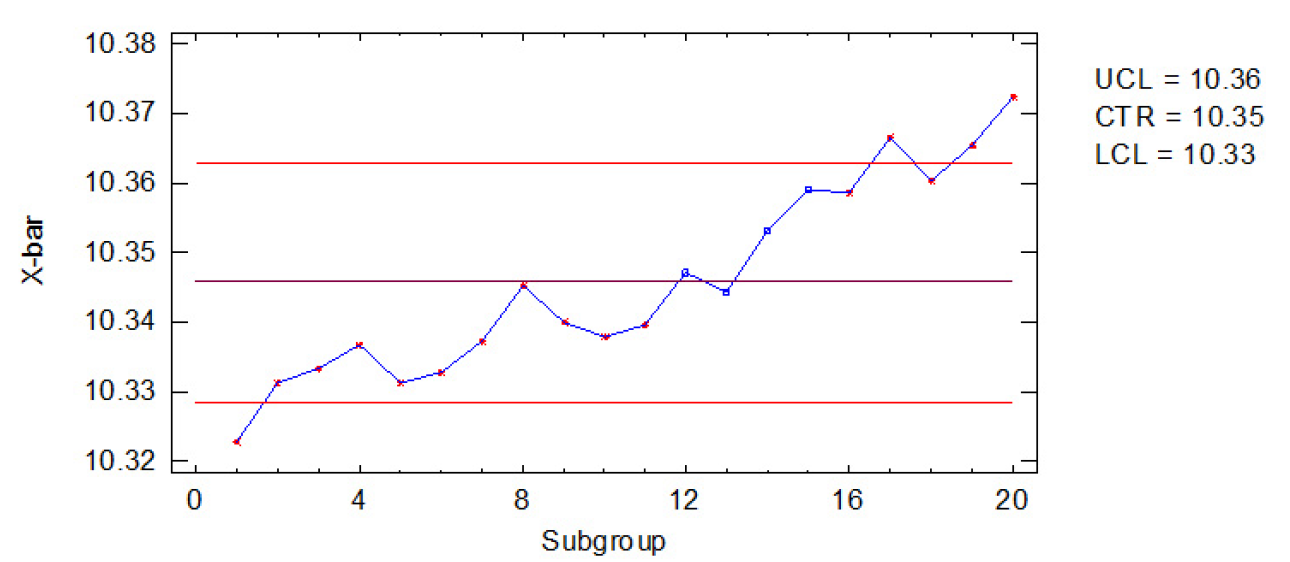
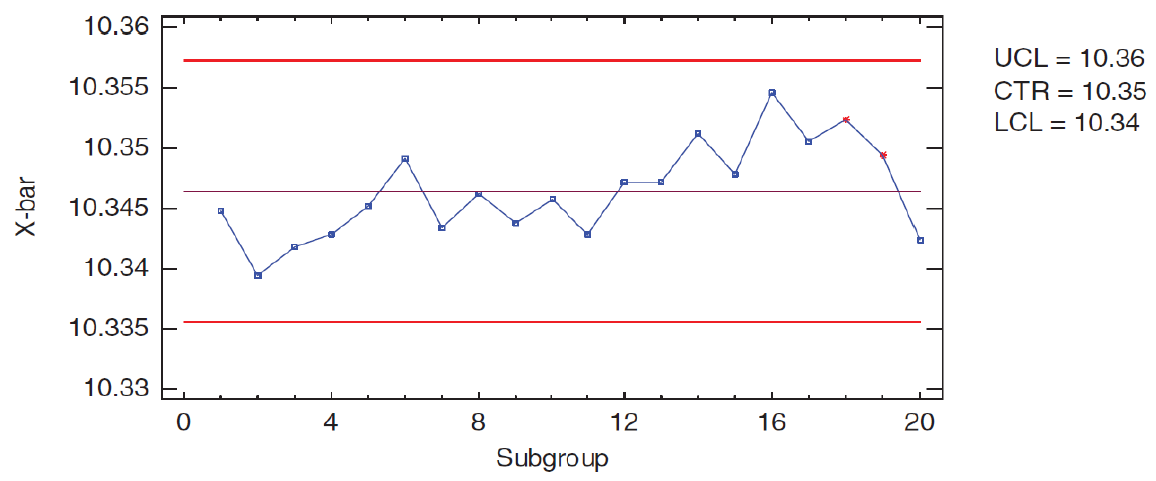
- Use of Control Charts:
- X-bar and R charts were utilized to monitor process mean and variability.
- The analysis showed that while amplitude values were within control limits, suggesting stable precision, the average values exceeded control limits, indicating instability in the process adjustment.
- A trend of increasing rivet heights over time was observed, implying an abnormality in the process.
Phase 3: ANALYZE
- Key Issues: Increasingly higher values of rivet height, controlling the riveting process, and enhancing statistical process capability.
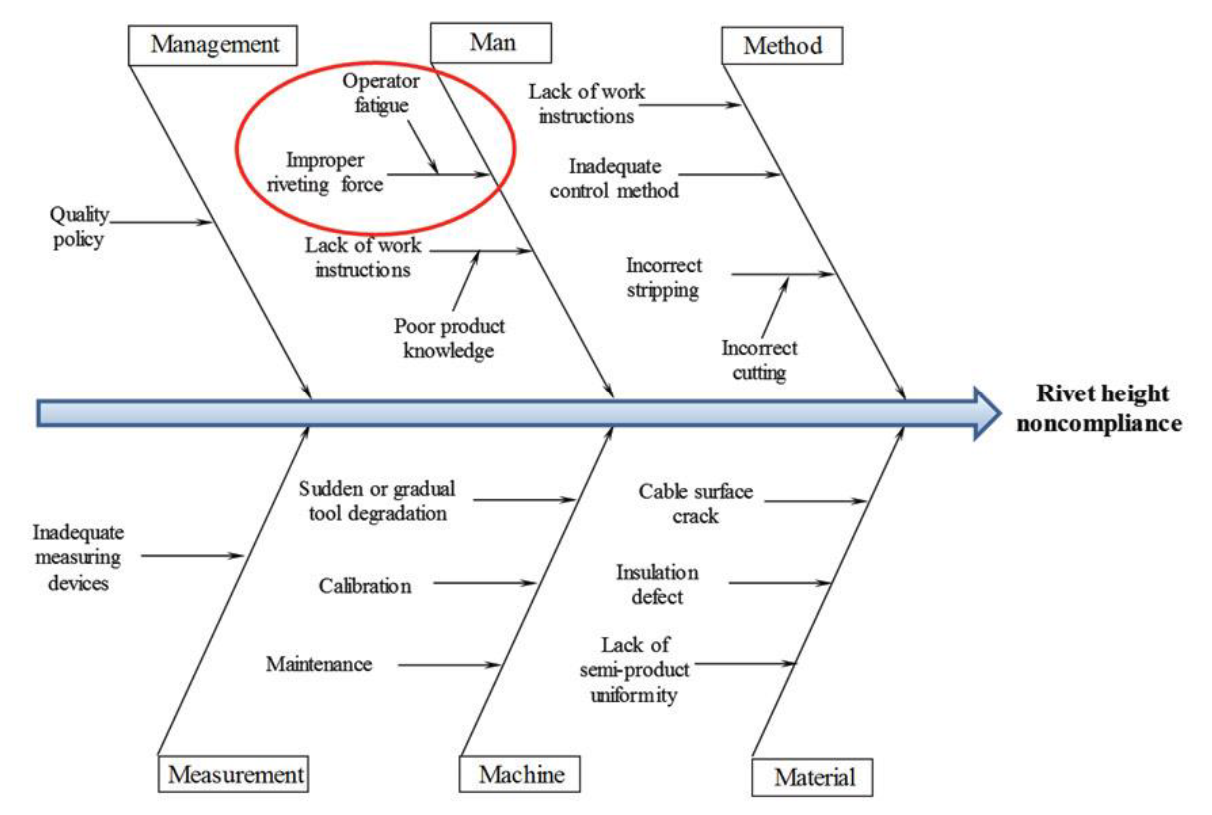
- Cause & Effect Analysis:
- Used a Cause and Effect diagram to identify key reasons for noncompliance in rivet height.
- The primary cause was determined to be improper riveting force due to operator fatigue over an eight-hour shift. This fatigue led to variations in applied force, causing inconsistencies in rivet height.
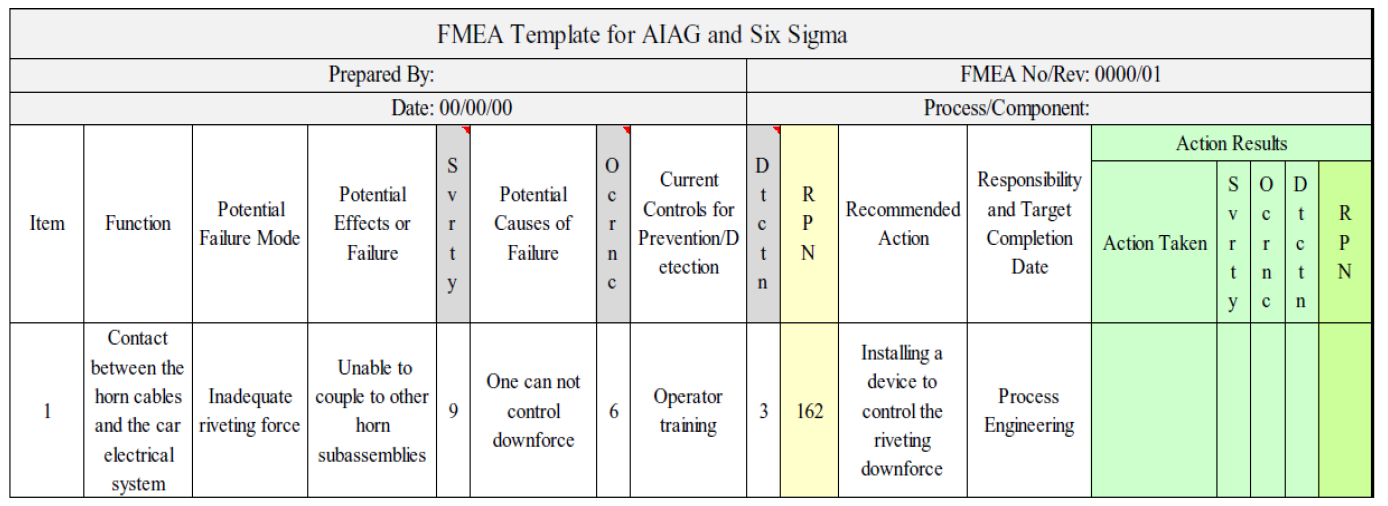
- Failure Mode and Effect Analysis (FMEA):
- FMEA was employed to assess all potential weaknesses in the product design and prioritize them based on their likelihood to cause product failure.
- The Risk Priority Number (RPN), ranging from 1 to 1000, was calculated to prioritize various failure modes and causes. A higher RPN indicates a greater risk of failure.
- The FMEA identified the contact from the upper wire horn assembly to the car’s electrical system as the function affected. The inadequate riveting force, linked to ineffective operator training, was noted as the potential failure mode.
- The proposed solutions included installing a device to control the riveting force and improving the design of the hand-operated lever used for riveting.
 This phase focused on understanding the root causes of the defects in the riveting process and developing potential solutions to address them, thus setting the stage for the subsequent IMPROVE phase.
Phase 4: IMPROVE
- Implemented Changes: A softer release spring was incorporated into the hand tool used for riveting, aiming to enhance operational precision and consistency.
- Poka-Yoke Device:
- The Poka-Yoke device is a preventative approach to quality control, designed to automatically prevent or highlight errors as they occur.
- In this specific application, a contact sensor with a warning system was utilized as a Poka-Yoke mechanism. This device provides visual and acoustic signals when the operator applies the correct amount of downward force, ensuring the attainment of the specified rivet height.
Phase 5: CONTROL
- Process Monitoring and Control: The improvements made in the previous phases were monitored to ensure the process was under control.
- Improved Process:
- The process capability, as indicated by the Cpk value, improved significantly from 0.68 to 1.72.
- This improvement resulted in a 40% reduction in defects in the riveting process.
- To check if the improved process is in control or not, all the rivet height measurements were plotted on X-bar and R charts. It was seen that all the data points were within control limits. Hence, the process is under statistical control.
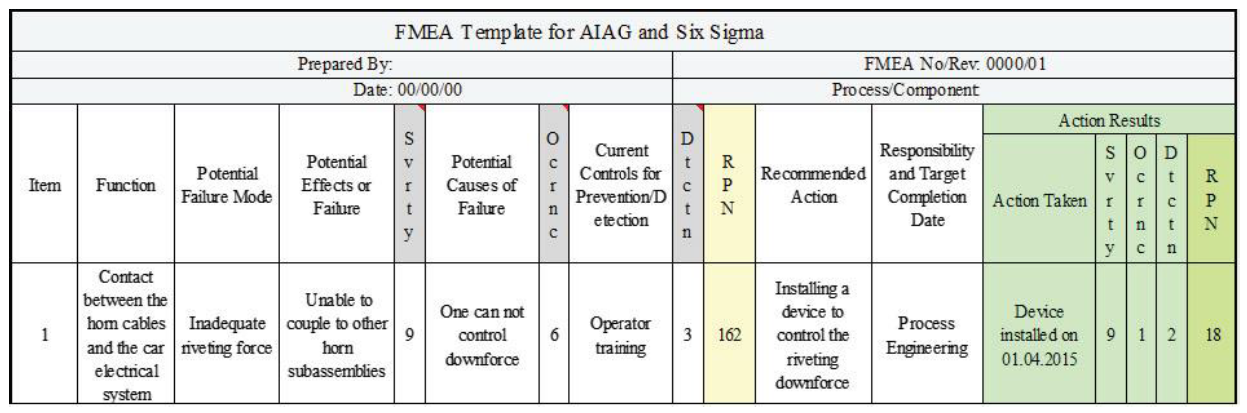
- After installing the Poka-yoke device, FMEA analysis was carried out and it was found that RPN value has become 18.
- Continuous Improvement and Future Steps:
- Continuing the improvement process by addressing other non-conformities identified in the Pareto analysis.
- Consideration was given to further automate the riveting process to reduce potential human errors.
- Impact on Business: The successful application of the DMAIC methodology led to improved production efficiency and quality.