
Optimization of Manufacturing Process Through Advanced Simulation Modeling
In the evolving field of manufacturing, the integration of simulation modeling techniques stands as a cornerstone for achieving operational efficiency and innovation. My project delved into optimization of manufacturing processe, leveraging the capabilities of ARENA simulation software.
Process Flow Improvement of a Batch Manufacturing System
The study aims to implement a computer simulation model for process flow improvement in a UPS manufacturing system.
Objectives
- Collect and analyze data for building an accurate model of a UPS manufacturing line.
- Develop a computer simulation model using ARENA.
- Analyze the existing manufacturing system under various circumstances.
- Identify problems and their causes using the model.
- Suggest solutions for specific problems and develop a proposed model to enhance system performance.
Process Flow Analysis using Queuing Theory
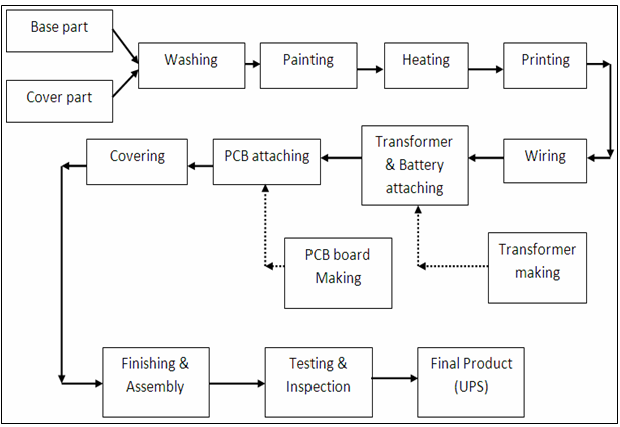
- The UPS manufacturing system analyzed consists of seven sections.
- The study involves data collection on various parameters like part arrival rates, processing rates, and resource availability.
- Data analysis was conducted using Arena Input Analyzer to determine the distribution function for production processes at each workstation.
Model Development
- The main goals of the simulation model were to minimize flow time, improve layout design, and maximize production rate.
- Key performance indicators for the system were identified as the production output and average queuing time of parts.
Data Collection and Analysis
- Essential data for generating the UPS manufacturing model were collected, focusing on parameters like parts arrival rates, availability of resources, part processing times, and batch sizes.
- The data collection process involved recording arrival times, processing start times, and end times for each part at every workstation. This was done using a time study method over seven working days, each consisting of seven hours.
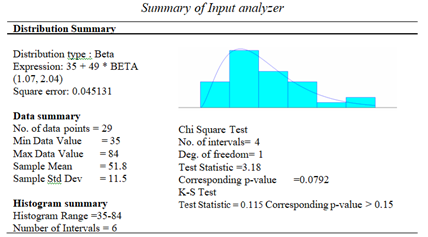
Utilization of Arena Input Analyzer
- The collected data were analyzed using the Arena Input Analyzer software to determine the appropriate distribution functions for various processes.
- This analysis helped in understanding the processing time distributions for different stages of the UPS manufacturing process. Examples include the use of Beta distribution for painting and wiring processes, Gamma distribution for coiling and attaching batteries, and Lognormal distribution for CCB and PCB processes.
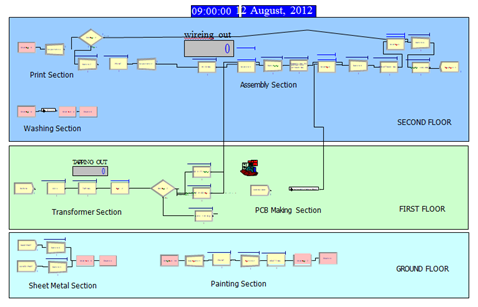
Development of the Simulation Model
Following the data analysis, a simulation model was constructed using ARENA. The model was designed to reflect the actual manufacturing process and provided a visual representation of the production line.
Simulation Setup and Output Analysis
- The simulation setup involved specifying a replication number of 4 and a replication length of 1260 minutes for each run.
- This setup used the analyzed data as input to simulate the manufacturing process, allowing for a detailed analysis of the system’s performance based on the specified parameters.
Identified Problems in the Manufacturing Line
- Transformer Section: Identified as the main bottleneck due to long queue times, suggesting the need for an additional server with proper positioning.
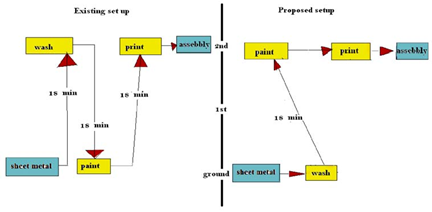
- Washing Plant: Layout issues leading to excessive part movement and time consumption, reducing overall productivity.
- Overall Floor Layout: Excessive transferring time due to inefficient layout.
Proposed Solutions and Alternatives
- For the transformer section, four solution alternatives were proposed, focusing on rearranging workstations and resource allocation to minimize waiting times and maximize output.
- Alternatives included varying the number of workers in coiling and tapping sections and introducing additional resources for core fitting.
- The washing section proposed a re-layout to reduce over-traveling of parts.
- The overall floor layout suggested repositioning the washing plant and print section to minimize transfer times and improve workflow.
Simulation and Comparative Analysis:
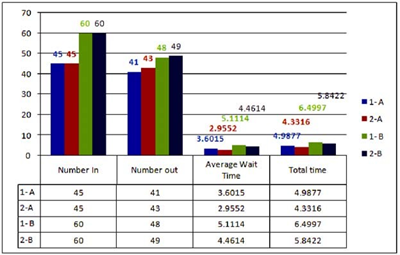
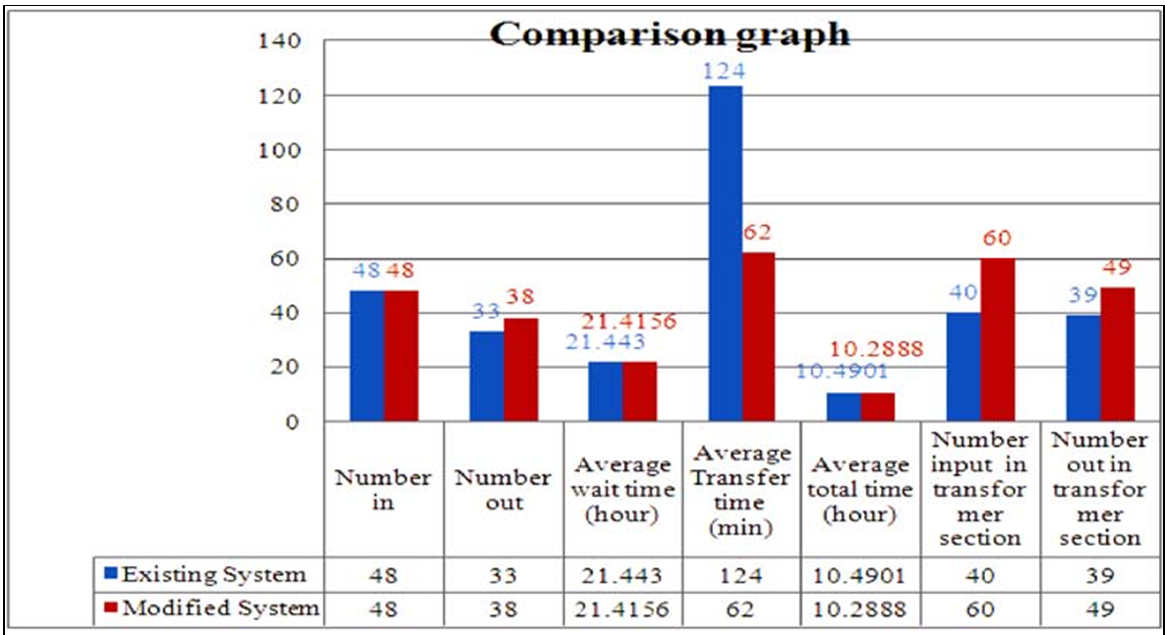
- The proposed changes were simulated, and the results were compared to the existing system.
- Key performance measures such as the number of units produced (output), average waiting time, and transfer time were analyzed.
- The proposed system showed a significant reduction in average total transfer time (by 50%) and an increase in productivity (15.15% increase in UPS production).
Conclusion
- The study concluded that the existing product flow layout in the UPS manufacturing was not optimal.
- The simulation model identified bottlenecks and evaluated solution alternatives, resulting in reduced average waiting times and increased production output.
- Recommendations included redesigning the facility layout, adjusting resource levels, and adding extra workers to improve system performance.